

Having a hard time to find out a javascript that can help in displaying the stock and timeline charts on your web/mobile application. Recently, I was working on a Drupal project where clients requirement was to add a similar feature to their web application. While doing secondary research our team came across Highstock - a javascript library - that allows you to create general timeline charts and insert them on the website.
Have a look at what exactly is Highstock?
Highstock helps in displaying the stock and timeline charts for web/mobile application based on certain data. Highstock chart offers a wide range of features like basic navigator series, date range, date picker, scrolling bar. Still wondering how to use this feature to its fullest - integrate Drupal 8 Rest API with Highstock javascript library.
Integrating Drupal 8 REST API with Highstock javascript library.
Step 1: Create a custom module. In my case, I will be creating a module name Highstock.
Step 2: Create a highstock.info.yml file.
Step 3: Create highstock.libraries.yml file to add highstock library.
Step 4: Create Rest API Resource, which provides the input for the chart.
Highstock accept the input in the following format: It requires the array structure, within that add x-axis, y-axis data with comma separated. So while creating REST API we need to generate the output in the following format.
[
[1297987200000,204011724],
[1298332800000,218135561],
[1298419200000,167962942],
[1298505600000,124974514],
[1298592000000,95004483],
[1298851200000,100768479]
]
Step 4.1: In Drupal 8, create HighstockChart.php file inside /src/Plugin/rest/resource.
Step 5: Create a highstock_chart.js file to integrate REST API output with a highstock library.
Highstock library provides various types of charts like single line series, line with marker and shadow, spline, step line, area spline etc. You can find the types of charts here https://www.highcharts.com/stock/demo.
In js, we have to call the API which gives you the JSON output. Based on type added for the chart output will be shown.
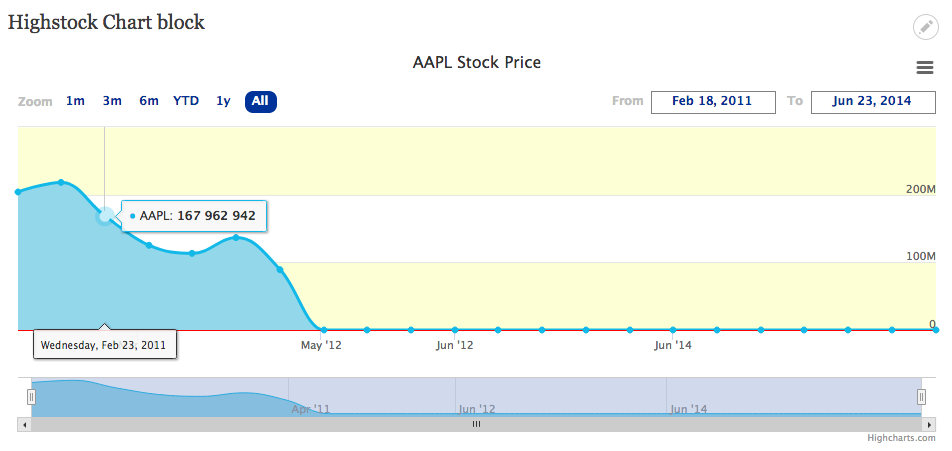
Step 6: Create a block HighstockChartBlock.php to show the chart.
Place the above block in any of your desired regions and it will display the chart like below:

Default JS provides the following properties:
-
Range selector
-
Data range
-
Scrollbar at the bottom.

-
Right side menu icon will provide an option to Print chart, download chart in PNG, JPEG, SVG, and PDF format.

-
Mouse Hovering will give Marker with x-axis and y-axis highlighted.

Properties of Highstock Chart:
Highstock javascript library provides several properties and methods to configure the chart. All these configurations can be found in highstock API reference. https://api.highcharts.com/highstock/.
We can modify charts using those properties. I have referred to the above link and configured my charts as mentioned below:
We must add the above properties in highstock_chart.js of your custom module. After applying all properties chart will look similar to the below image.
This API is very handy when it comes to representing Complex Data structures to end users in the form of colorful charts. You should definitely pitch this one to the clients if they are still showing Data in traditional Tables, Excel sheet, etc. Hope now you can easily integrate Drupal 8 Rest API with Highstock. If you have any suggestions or queries please comment down let me try to answer.