Over the period of time, website performance degrades significantly affecting the business in terms of traffic, sales, marketing etc. And there can be n-number of reasons for the poor performance of the website. In this scenario, performance enhancement is one of the solutions to keep your website as well as the business running efficiently.
Well, there are various tools to debug the performance of web applications. In case your website is running on Drupal 8, then you need not worry as there are various contributed modules that help to identify the reasons and debug the site. Here we will explore how Web profiler helps in enhancing Drupal 8 site performance.
Below are the most used and trusted modules that helps to debug site performance. It will also help you to learn how your site handles page requests
| Drupal Version | Module |
| Drupal 7 | Devel |
| Drupal 8 | Web Profiler |
So what is Web Profiler
Web Profiler is a Drupal 8 Contributed Module (now a sub-module of Devel). It is built on the top of Symfony Web Profiler component. Hence, this component is a must for web profiler module to work.
Integrating Web Profiler with Drupal 8
Since Web profiler is a sub-module of Devel, we need to download the Devel and install the web profiler.
After enabling Web Profiler module, it renders a fixed bar at the bottom of each page for users.

Web profiler also provides permission for each role - The View Web Profiler toolbar permission. With this permission, you can decide which user you want to show the toolbar.
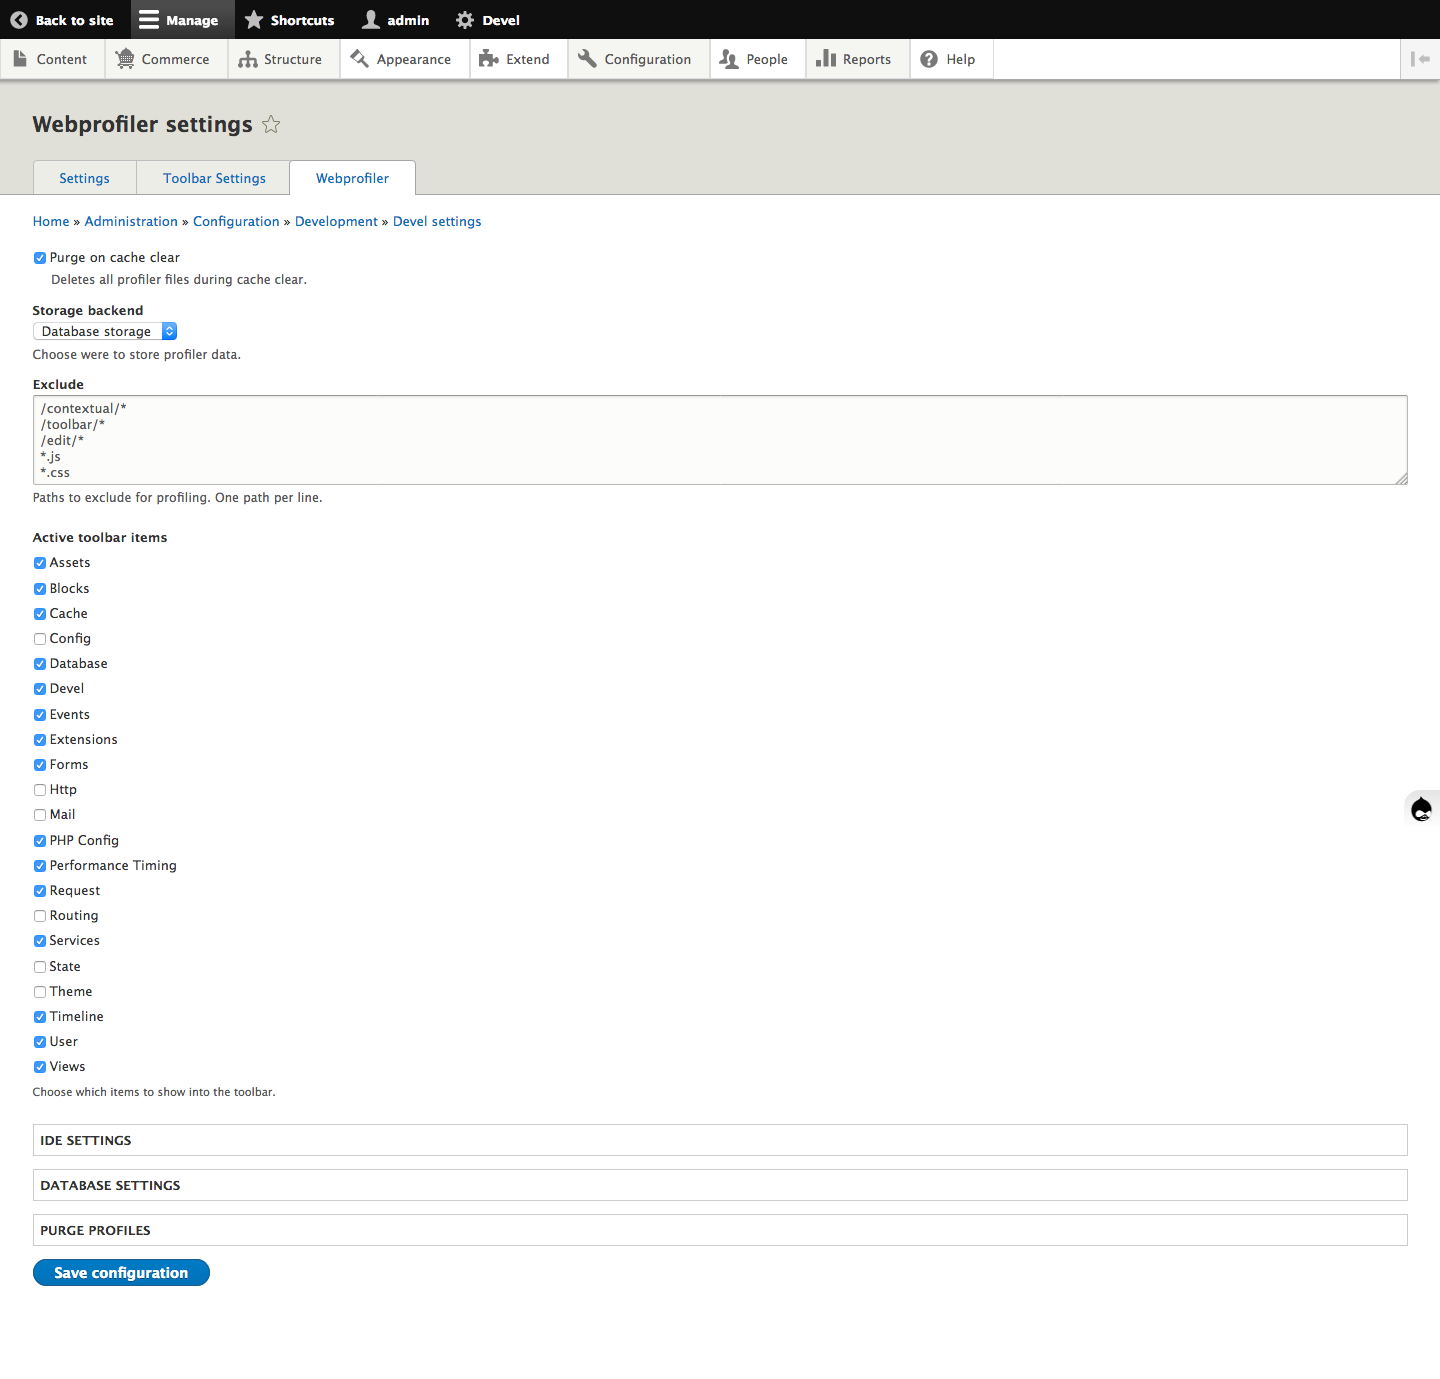
It also provides the configuration page (Go to Configuration -> development -> Devel settings -> Web profiler) where you can do all sorts of configuration related to toolbar items, IDE settings.
Select the checkbox in configuration page to fix which items should be displayed at the bottom of each page.

By clicking on any of the items at toolbar, you will be taken to the full profiler output.

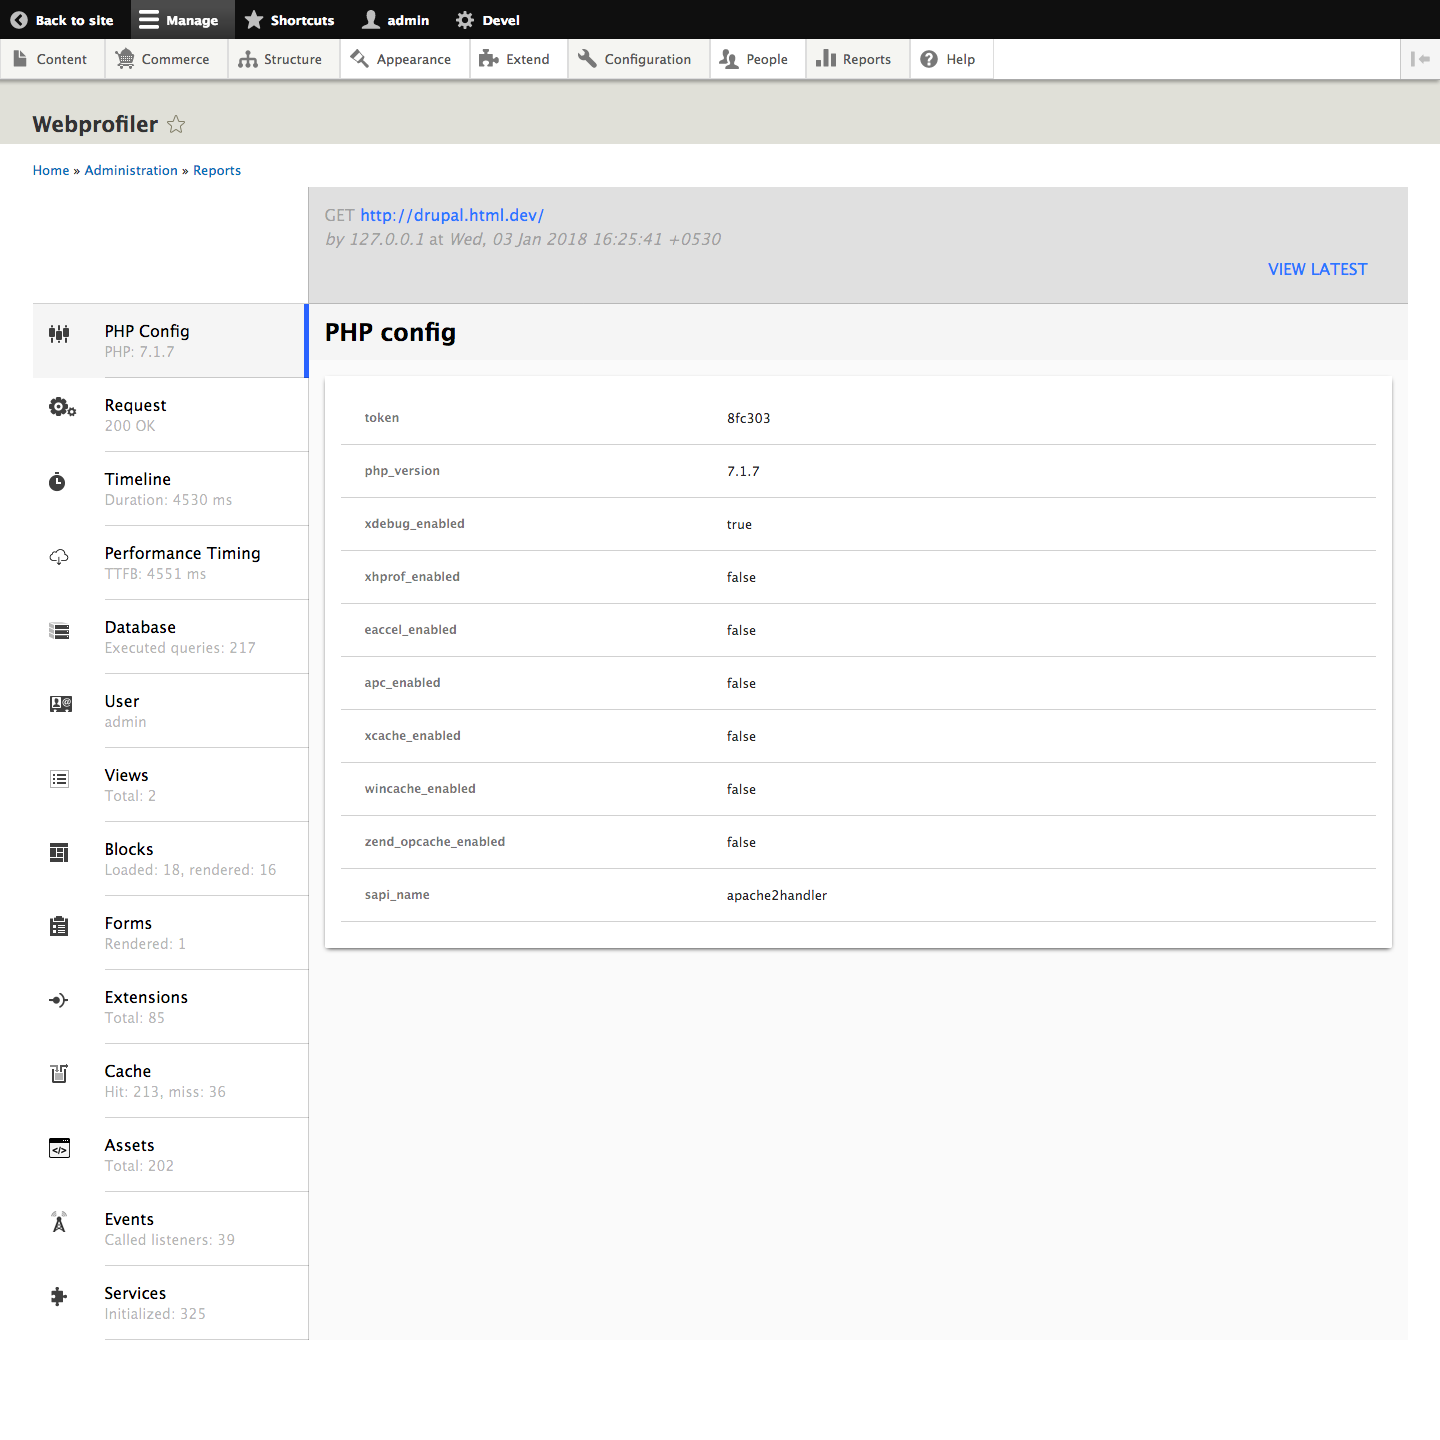
In full profiler, we can see vertical tabs. Check out the description of each tab below.
PHP config - This section gives information about PHP configuration on your server.
Request - It provides information about page request. Cookies, request and response headers as well as server parameters are also provided.
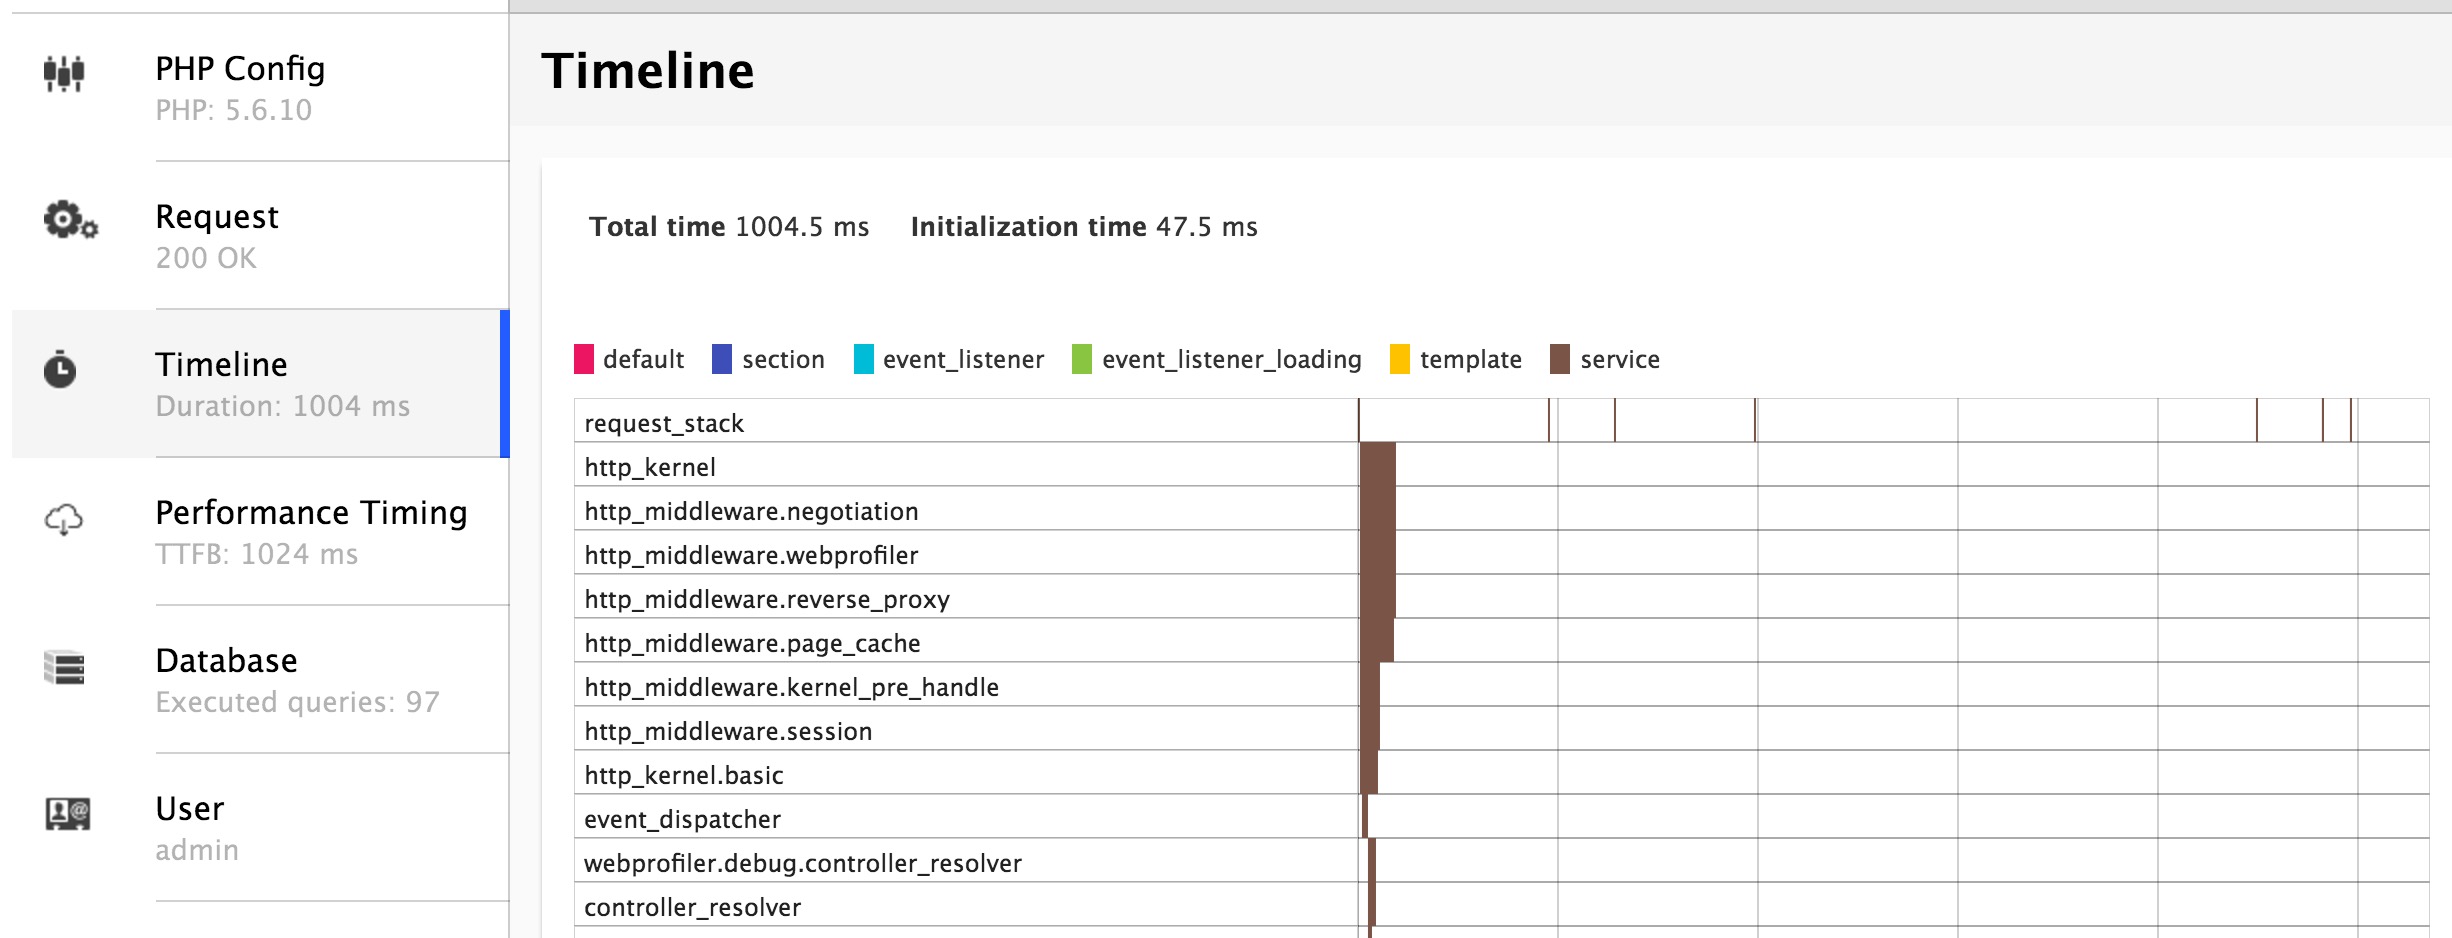
Timeline - This is nothing but a graph which gives information about the controller, events that are called for particular page request and how much time they have taken to compile.
Database - It gives a list of all the queries, which are executed for a particular page request.
User - This section provides information about logged in user i.e name, authentication, roles.
Views - It shows a list of views that were rendered on the current page with their respective build time, execute time, and render time.
Blocks - This shows a list of blocks that were rendered on the current page.
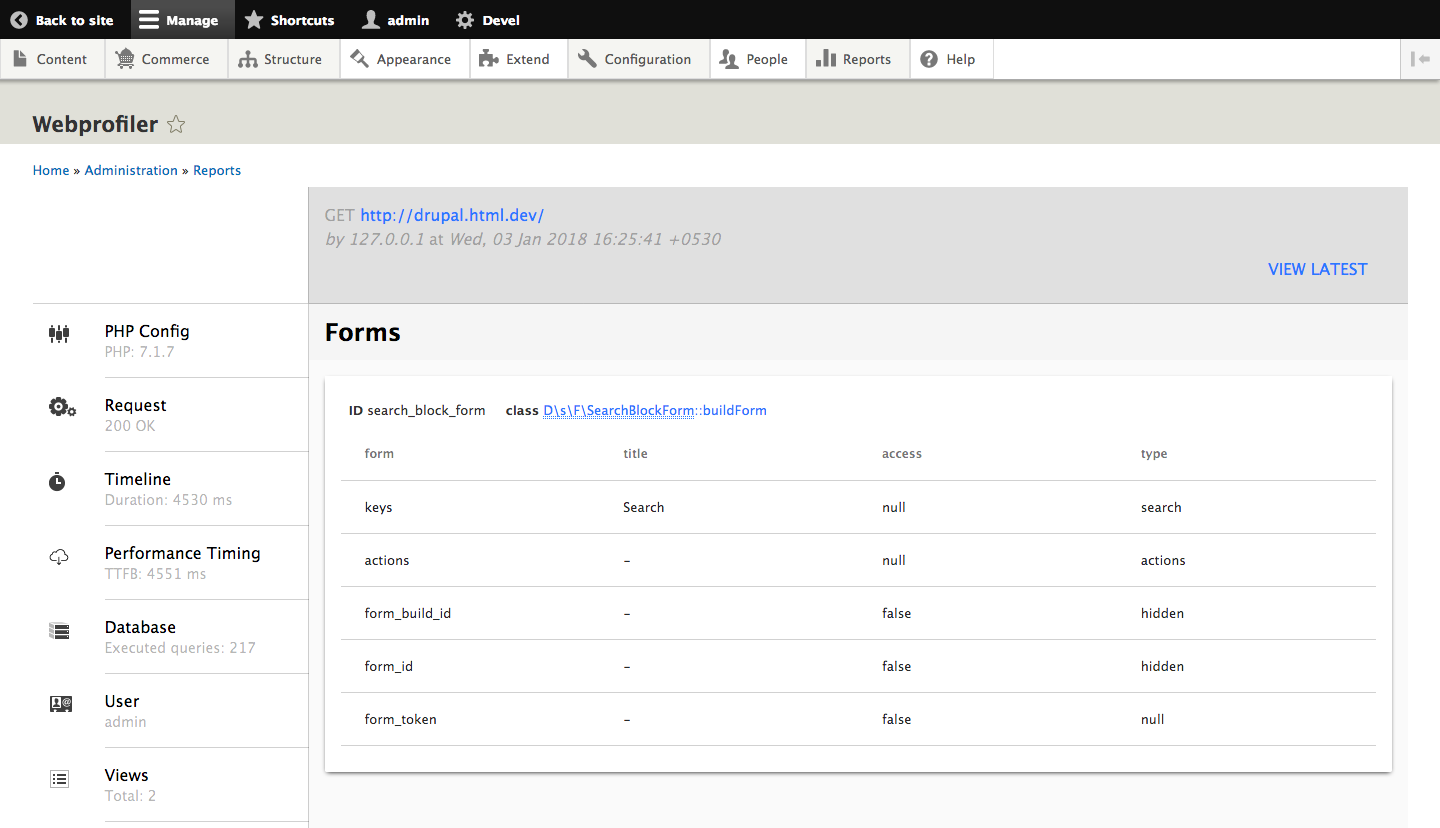
Forms - This section lists the forms built on the current page.
Extensions - This section lists all the modules and theme that are enabled on your site.
Cache - This section lists the different caches and the respective number of hits or misses.
Install Libraries to render timeline
Web Profiler requires two javascript libraries to render the timeline and to syntax highlight collected queries. In Drupal 8, these javascript libraries are optional and work without even installing them.
- Highlight.js
Highlight.js is used to highlight the syntax of queries.

Create /libraries/highlightjs/ directory inside your Drupal root directory.
You can download the library from http://highlightjs.org and copy js and styles folder from downloaded folder and place in /libraries/highlightjs.
D3.js
D3.js is used when viewing the timeline page.
Download the D3.js from https://github.com/d3/d3/archive/v3.5.17.zip and place in /libraries/d3 folder.
Note: Web Profiler module requires D3 library 3.x (not 4.x) to render data.
Displaying Timeline
Add the following codebase to your settings.php or settings.local.php in order to display the details of Web Profiler on the timeline page.
The codes are also available in /devel/webprofiler/README.md.
         $class_loader->addPsr4('Drupal\\webprofiler\\', [ __DIR__ . '/../../modules/contrib/devel/webprofiler/src']);
         $settings['container_base_class'] = '\Drupal\webprofiler\DependencyInjection\TraceableContainer';
Remember that the code above assumes, you’ll add the devel module at /modules/contrib/devel.

IDE Integration
In detailed profiler view, the class name is mentioned.

Each class name is linked to open the class in an IDE. Click on the link to open class in defined IDE. The setting is available in module configuration page.
Configure the following URLs to work for your IDE.
Textmate
Use txmt://open?url=file://@fileline=@line
PhpStorm 8+
Use phpstorm://open?file=@fileline=@line
Well, there are various ways you can debug Drupal 8 website performance, including web profiler. Alternatively, you can explore caching methods as well as other techniques.
Hope this blog will be helpful to you. Comment below if you still face any problem with performance enhancement. Will be happy to answer your question.
Below given is a presentation on debugging Drupal website using Web Profiler.


