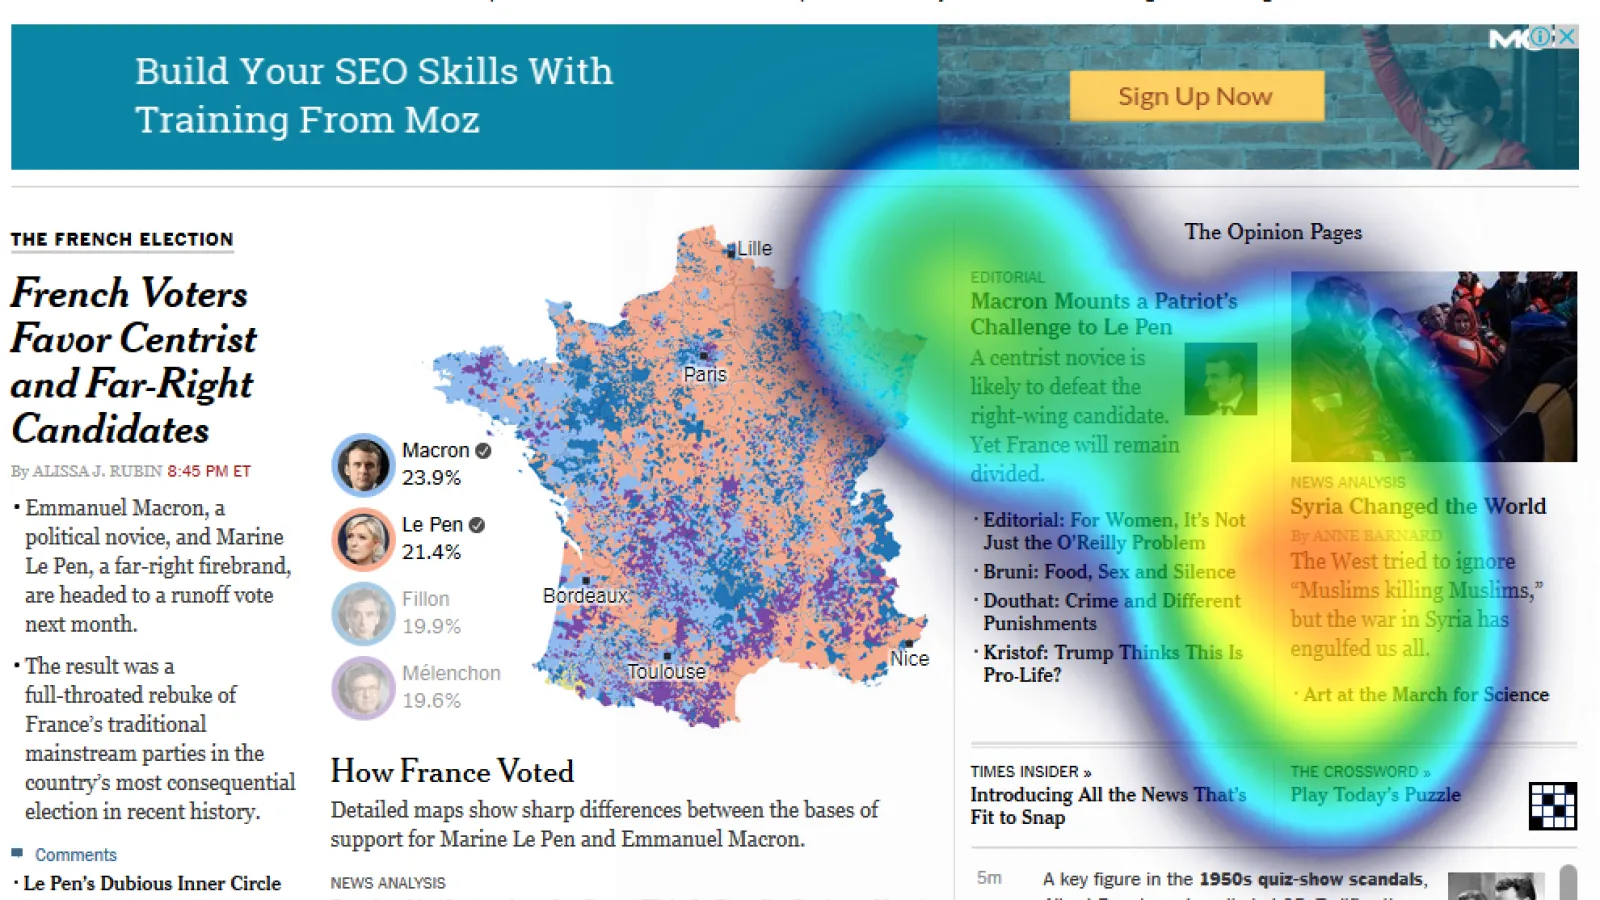
Most of the media companies are competing in content marketing in the online world and battling with the question, whether their content is faring well than the others. Analytics and metrics give deep insights on number of visits, visitors, duration of a visitor’s visit, the entry and exit points, but misses on the granular data such as the engagement level and interaction on the content page.
To measure the missing connect, publishing companies have moved towards heatmap tracking tools; to understand how people interact with the content on the website. Heatmap is a visual overlay that has the appearance of an infrared display with colour variations indicating high and low levels of activity. These heatmap tracking tools are very useful when preparing website navigation, layout and in designing user friendly interface.
Heatmaps can measure - click, move and scroll, that means it can track where users have clicked on a page, how far they have scrolled on a page, and have also been used to display the results of eye-tracking movements and these results are displayed in real time.
When used along with other analytical tools, these heat map tracking tools give a good result in optimising website, understanding the aggregated behaviour of site visitors on content, generating content performance and driving higher conversion rates.
The most popular website heat maps used by media companies are the following:
1. Crazy Egg: Crazy Egg is one of the most popular heat map tools. It offers click, mouse cursor, and scroll heatmaps. It offers another useful feature called confetti heat map. Confetti heatmap divides the data into traffic sources, enabling the user to figure out where the most profitable traffic is arriving from. The clicks can be separated by a number of variables, such as device, region, or campaign, thus, giving a better insight. WPMU Dev used Crazy Egg’s confetti report to see how their visitors were interacting with content on their product page and identified the important parts of the navigation menu and redesigned the product page.
Crazy Egg also gives a comparison of mobile versus desktop visitors to see how the two different groups interact with the content. Unlike other heatmap tracking tools, it does not limit usage to per site, this means one can use the same account on multiple websites. What goes amiss here is that there is no screen-capture recording of the visitors and they do limit the number of active pages. However, Crazy Egg has been utilised by most companies to drive sales. For instance, Softmedia, a world’s leading provider in penny auction software used Crazy Egg heatmaps to identify problem areas on their website. They successfully identified distractions that were preventing visitors from completing the desired actions. After removing these, conversions increased by 51%, and also improved their user interface.
2. Mouseflow: Mouseflow is another easy to use heatmap tool for WordPress users. Mouseflow offers click, scroll, movement and attention heatmap. It also offers recording of website visitor activity. Sticker Gigant, an emerging social media beauty brand from Germany, approached Mouseflow on relaunch of their website to engage users better and to drive performance. With the help of Mouseflow, Sticker Gigant was able to identify issues in the user interface immediately after relaunching the website. After relaunch, Mouseflow improved the average shopping basket value by 78%, increased orders with iOS devices by 26%, and raised cross-selling with first orders by 18%. These numbers are evidence of how effective heat maps are and these are great tools for tracking website traffic.
Another useful feature offered by Mouseflow is form analytics, which allows one to see why users are abandoning forms. It also tracks funnels, custom funnels can be setup to understand the different sources of traffic and their behaviour. Media companies using Wordpress tend to use their WordPress plugin as it provides support for WordPress multi-sites, which lets one watch the analytics from various domains through a single source; giving insights not only on visitor demographics but also visitor activity.
3. Inspectlet: is a very powerful session recording and heatmap service. It displays how people interact on web-pages employs eye-tracking, shows clicking as well as scrolling on the heatmaps. Their conversion funnel analytics is ideal for those selling products online and their engagement heatmaps are also impressively detailed, tracks all interactions including visitors comments. They also offer conversion funnel analytics with powerful tagging filtering feature along with form analytics to understand and optimise lead generation. This feature has been helpful for those driving multiple websites in e commerce.
Blue Kangaroo, a social retail website, features trending products and deals from thousands of stores. Prior to Inspectlet, Blue Kangaroo relied solely on analytic charts and graphs to better understand their users. With Inspectlet, Blue Kangaroo could compare how much time their audience was spending on similar products. Taking these inputs into account, Blue Kangaroo improved their algorithm and design, leading to an 84% increase in total clicks.
Heatmap tracking tools give detailed overview of how well users are engaging with the website along with how these are used as tools for tracking website traffic. Heatmaps show both - qualitative and quantitative behavioural metrics.
Media companies are using these heat maps not only to understand the user interface but also using it to get a broader view social media impressions. For, instance-'one million tweet map', is used to see how often people are tweeting around the world and the top trending topics they're tweeting about. Such heat maps provide an idea of when and where specific conversations are/were at their peak. It helps companies to track trending conversations, understand where exactly these conversations are taking place, also use these tools for tracking website traffic as well as track the success of a particular online campaign.
The visual representation makes it easier to analyse the data and gives a direction to improve search rankings, performance and deliver better user experience.
Discalimer : Image used above is no a real time tracked one, but just for reference.


