Every business wants to keep their customers coming back for more. Customer Experience (CX) is the secret sauce! But it's not just about saying "thank you" at the checkout; it's more about understanding your customers' needs and their expectations.
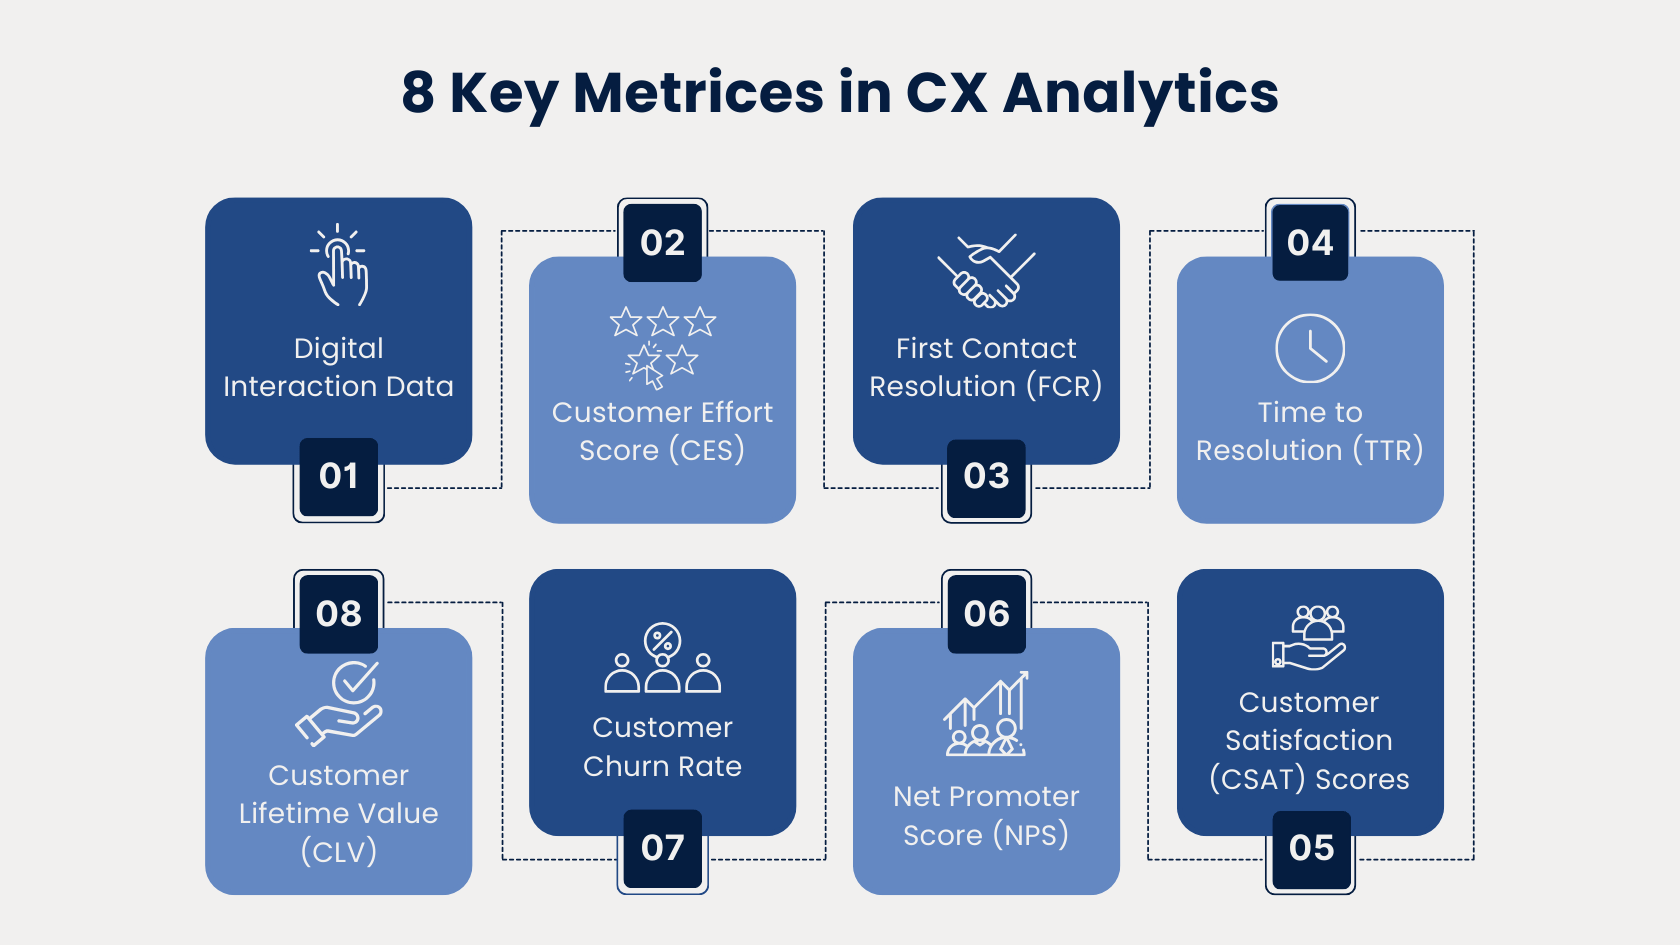
But where should you start? What key metrics should you focus on to improve customer experiences and at which interaction should we be collecting them? In this blog post, we'll walk you through the most critical data points to monitor in CX analytics to ensure you're making the right decisions to improve customer experience.

Digital Interaction Data (DID) - Beginning of the Journey
Tracking data on digital interactions—such as website visits, time spent on pages, click-through rates (CTR), and conversion rates—gives insight into how customers are engaging with your digital platforms.
Analyzing where users drop off during the journey allows you to fine-tune design elements, optimize page load times, or personalize content to encourage deeper engagement. Moreover, assessing mobile vs. desktop behavior provides valuable data on how to tailor experiences across devices.
Why It Matters:
- Digital touchpoints are often the first place customers interact with your brand. Poor digital experiences can lead to high bounce rates and lost revenue.
- Tracking this data through CX Analytics allows you to optimize the digital journey and improve the customer experience on websites, mobile apps, and other digital channels.
How to Use It:
- Monitor digital engagement across different customer segments to customize experiences for specific audiences.
- Track how changes in digital UX (user experience) impact engagement and conversion metrics.
Customer Effort Score (CES) - After Initial Interactions or Purchases
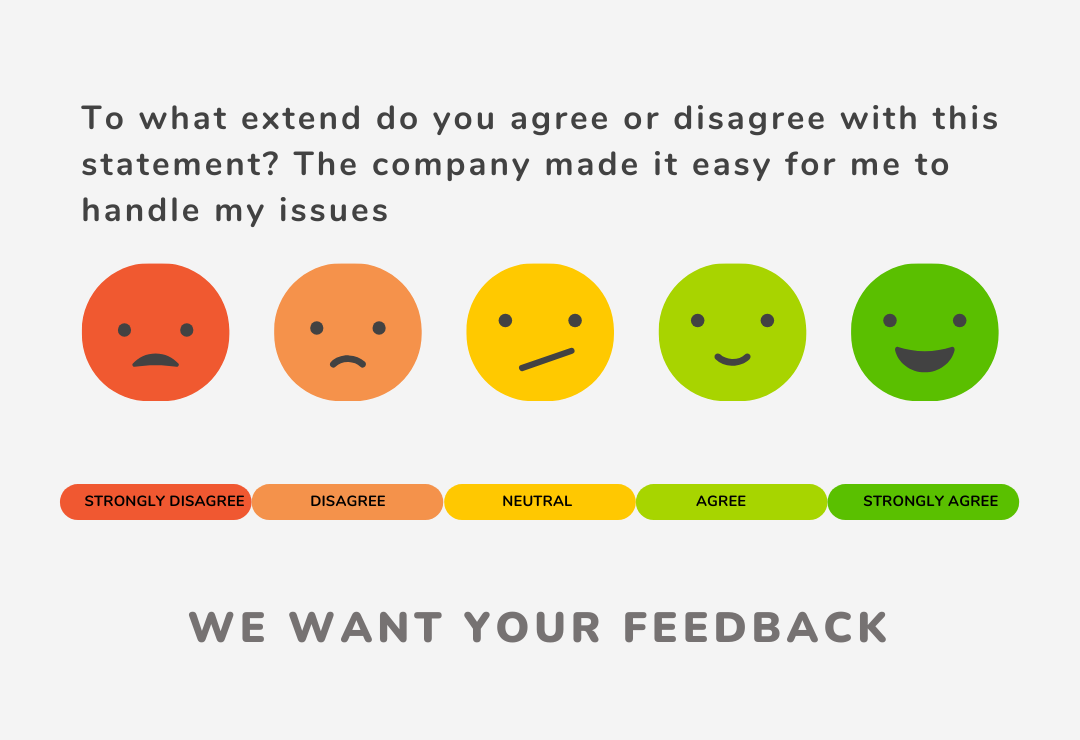
After a customer has completed a specific task, such as making a purchase, interacting with customer support, or using self-service options on your website or app, we should check the Customer Effort Score (CES) to measure how much effort the customer had to put in to resolve an issue or complete an interaction with your business.

CES surveys usually ask something like: How easy was it to solve your problem today?
A high CES combined with low repeat purchase rates could indicate an urgent need for self-service features. Additionally, it's essential to track CES across different customer demographics or product lines to uncover hidden barriers specific to certain user groups.
Why It Matters:
Studies show that customers who have to spend more effort are less likely to return. In fact, reducing customer effort is often a more effective way to increase loyalty than exceeding expectations.
- CX Analytics through CES helps you identify friction points in your customer service or product experience.
How to Use It:
Analyze CES across different touchpoints (e.g., contacting customer service, navigating the website, purchasing a product) to identify pain points that make it harder for customers to complete their desired actions.
First Contact Resolution (FCR) - Post-Customer Support Interaction
First Contact Resolution (FCR) measures the percentage of customer issues that are resolved in a single interaction, typically during the 'support' stage of the journey. After a customer engages with your support team for the first time, either through chat, email, or phone, CX Analytics suggests that a high FCR is an indicator of an efficient customer service process.
You can also consider the nature of the problems addressed in one interaction—are they simple questions, or do more complex problems get settled? This data will help identify whether your knowledge base or FAQ section requires enhancements or if further agent training is needed to tackle more nuanced customer issues efficiently.
Why It Matters:
- Resolving issues on the first contact can prevent frustration and reduce the number of follow-up interactions, directly impacting customer satisfaction and loyalty.
How to Use It:
- Track FCR by individual service agents, departments, or customer service channels (e.g., phone, email, chat) to see where your team excels and where they need more support.
- Set benchmarks for FCR and develop training programs for customer service teams to improve their problem-solving efficiency.
Time to Resolution (TTR) - Post-Customer Support Interaction
Time to Resolution (TTR) is the average amount of time it takes to resolve a customer issue or inquiry. Alongside FCR, TTR is important once a customer issue has been raised and resolved. It measures how efficiently problems are being solved across customer service interactions.
Analyzing TTR in conjunction with customer sentiment (such as post-interaction surveys) can highlight whether quick resolutions are truly effective. Additionally, automating common issue resolutions through AI chatbots can reduce TTR for frequently occurring queries, freeing up human agents to focus on more complicated cases.
Why It Matters:
- Customers don’t just want their problems solved; they want them solved quickly. A long TTR can lead to frustration, while quick resolutions can boost CSAT and NPS.
- TTR helps you evaluate the efficiency of your customer support processes and how well your team handles complex issues.
How to Use It:
- Measure TTR across different types of issues (simple vs. complex) and service channels to identify where bottlenecks occur.
Customer Satisfaction (CSAT) Scores - After Key Interactions
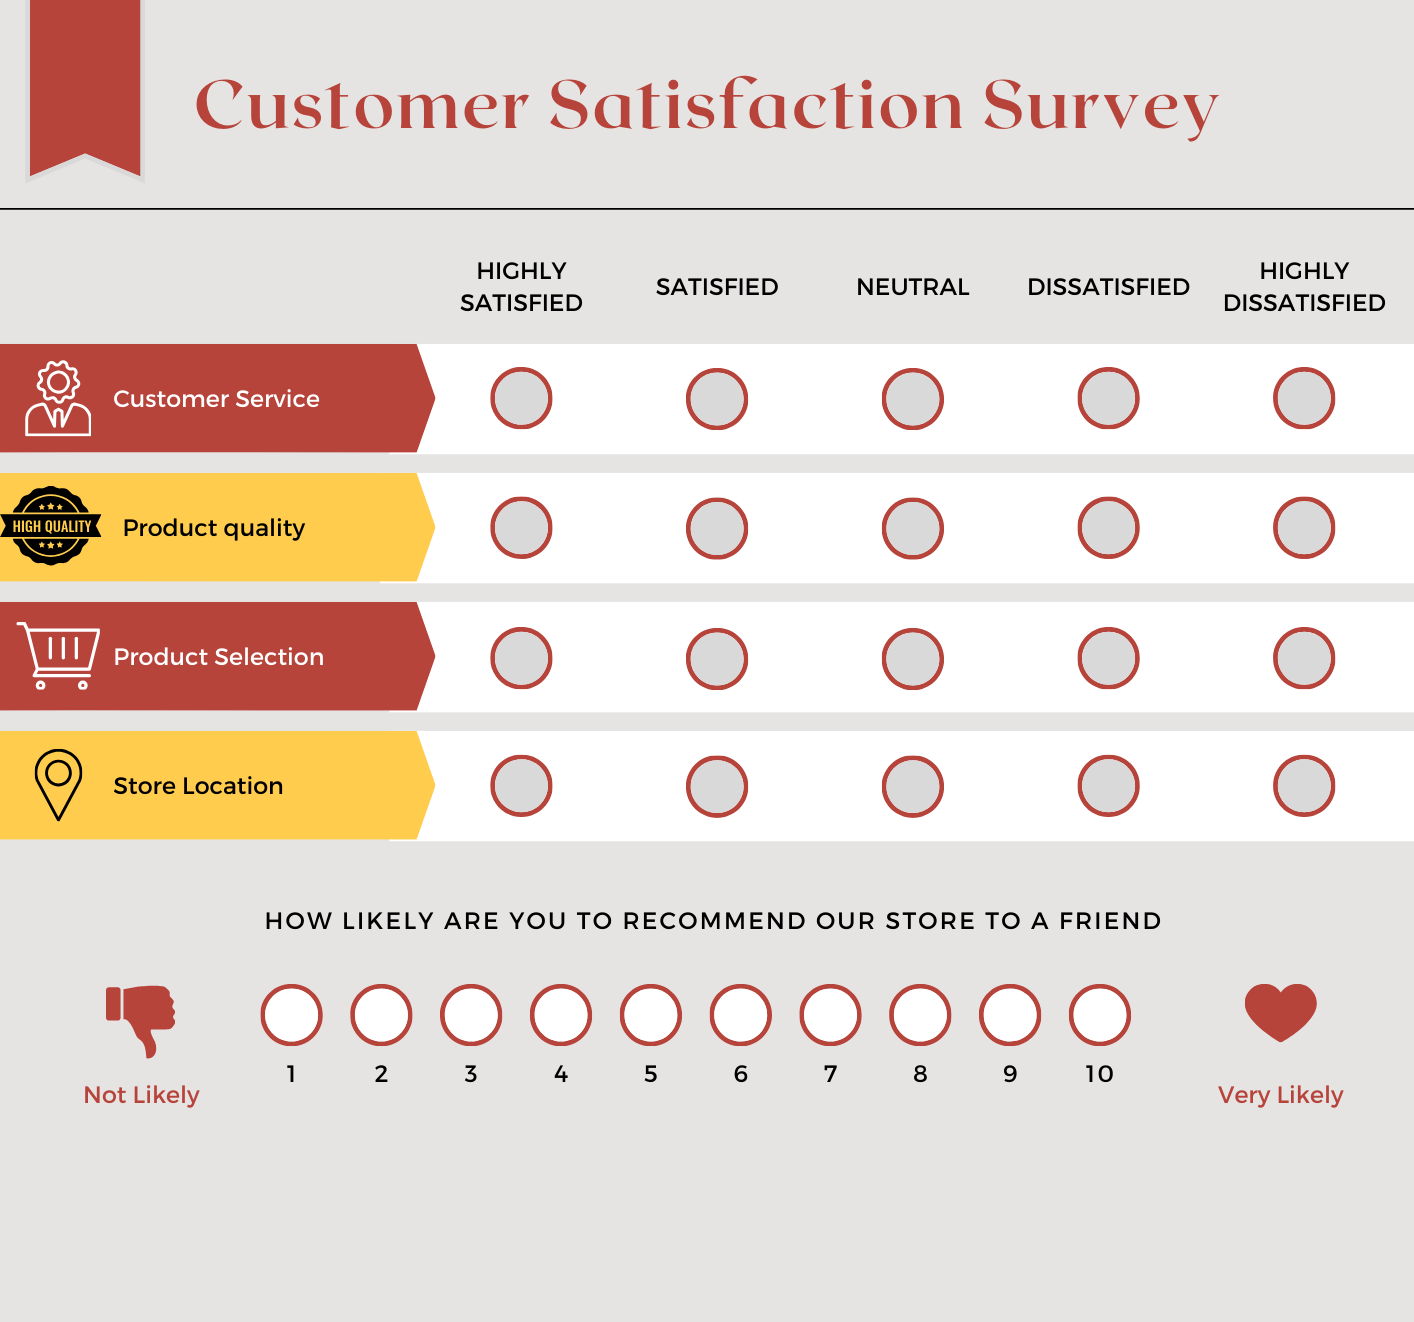
We check CSAT after significant milestones in the customer journey, such as product purchases, delivery, customer service interactions, or feature usage. Customer Satisfaction (CSAT) is one of the most direct and widely used measures of how customers feel about a specific interaction, product, or service. The score typically comes from post-interaction surveys asking customers to rate their satisfaction on a scale (e.g., 1 to 5).

Why It Matters:
- CSAT gives immediate, actionable feedback on whether your customers are satisfied with a specific aspect of your business.
- Tracking CSAT over time helps identify trends and pinpoint areas that consistently exceed or fall below customer expectations.
- FCR is a key driver of both CSAT and CES. Customers who have to return for multiple contacts are more likely to express dissatisfaction.
How to Use It:
- Use CSAT scores to evaluate the effectiveness of customer service, product quality, or website usability.
- Monitor how changes in your business operations (new product features, updated service processes, etc.) impact customer satisfaction.
Net Promoter Score (NPS) - During and Post-Journey
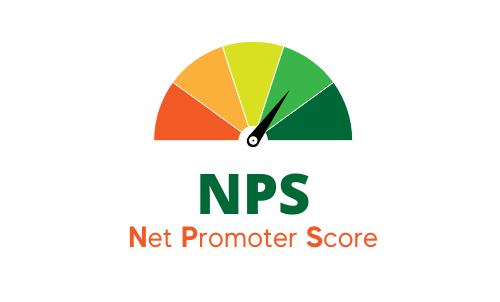
Net Promoter Score (NPS) is a metric that measures customer loyalty by asking a simple question: 'How likely are you to recommend our company/product to a friend or colleague?' Based on their response, customers are categorized as Promoters, Passives, or Detractors.
NPS is typically measured after the customer has had sufficient interaction with your product or service to form an overall impression, usually post-purchase or after using your service for a period of time.

Why It Matters:
- NPS is a great indicator of long-term customer loyalty and growth potential.
- High NPS means your customers are likely to act as ambassadors for your brand, while low NPS indicates you may have brand advocates turning away from you.
- Compare CES with CSAT and NPS to see how ease of interaction correlates with overall satisfaction and loyalty.
How to Use It:
- Track NPS over time to understand how changes in the customer journey impact customer loyalty.
- Segment your NPS data by customer demographics, regions, or touchpoints to identify specific areas that need improvement.
- Through CX Analytics, analyze what makes Promoters advocate for your brand and what drives Detractors’ dissatisfaction.
Customer Churn Rate - Long-Term Tracking
Customer churn rate refers to the percentage of customers who stop doing business with your company over a given period. It is a key indicator of how well you are retaining customers, especially in subscription-based models or when customers discontinue using your product or service.
To get a clearer picture, compare churn rates among different customer segments (such as first-time buyers vs. long-term clients) and tie them back to specific CX interactions. Moreover, CX Analytics can track behavioral indicators—such as a decrease in product usage or support inquiries—which will serve as early warning signs of potential churn, allowing businesses to intervene before it's too late.
Why It Matters:
- Retaining existing customers is often much more cost-effective than acquiring new ones. High churn rates indicate problems in customer retention, which could be due to poor CX, pricing issues, or unmet expectations.
- Churn rate directly impacts revenue and profitability. For subscription-based businesses, a high churn rate can indicate potential long-term sustainability issues.
How to Use It:
- Track churn by customer segments to identify which groups are more likely to leave and why.
- Use predictive analytics to identify at-risk customers and proactively take measures to improve their experience.
Customer Lifetime Value (CLV) - Long-Term Tracking
Customer Lifetime Value (CLV) is the projected total revenue a customer will generate for your company throughout their relationship with your brand. CLV is measured continuously throughout the customer relationship, emphasizing the value that repeat customers bring over time.
Offering personalized experiences, tailored recommendations, or exclusive content to high-CLV customers can significantly boost retention and encourage repeat purchases. Additionally, consider tracking how upsell or cross-sell opportunities impact CLV, as well as how different touchpoints along the journey contribute to the overall value a customer brings.
Why It Matters:
- CLV helps you understand which customers provide the most long-term value and can inform customer retention and acquisition strategies.
- By improving the customer experience, businesses can increase CLV by encouraging more repeat purchases and deeper engagement.
How to Use It:
- Track CLV by customer segments to identify high-value customers and determine what drives their loyalty.
- Invest in CX initiatives that increase CLV by improving satisfaction and retention rates for these key segments.
Conclusion
Monitoring the right CX data points enables you to make informed and data-driven decisions to improve your customer experience. Data points we discussed above, like digital interaction data, CSAT, or NPS, can help you figure out the areas of improvement which in turn will improve the bottom line.
Whether it's about optimizing digital touchpoints or improving customer retention strategies, our experts at Valuebound are here to guide you every step of the way. Contact us today to discover how we can help you boost your Customer Lifetime Value and reduce churn with cutting-edge CX solutions.


